Case study · Commercial fishing
Predictive fishing intelligence
An AI copilot for working trawlers. It tells the captain where the fish will feed tomorrow, and when, before the boat leaves port.
- Client
- Early-stage maritime technology venture
- Users
- Trawler captains; marine researchers
- Product
- Predictive fishing zone app (PWA)
- Timeline
- Brief to client-ready in under two weeks
At a glance
The benchmarks it commits to
Inside strong zones. Nets drop on scored water, not on hunches.
Syncs on a weak harbor signal in seconds.
The chart works all day with zero signal at sea.
Usable with wet gloves. No typing.
These are the benchmarks the product was designed and validated against, printed on the launch site because captains fish on proof. They are product commitments, not measured fleet results.
The problem
The margin burns before the first net goes in
Fuel is the largest controllable cost on a fishing vessel, and most of it burns during the search: steaming in patterns, chasing radio rumors and setting nets on water that looks right but holds nothing.
The client came with a sharp observation. Industrial fleets have sonar suites, satellite subscriptions and analysts onshore. The captain of a 15-meter trawler has instinct, yesterday's luck and a fuel bill that decides whether the season pays. The ocean data that predicts where fish will feed already exists in public oceanographic sources. Nobody had packaged it for the person standing at the wheel at 4 a.m.
Three costs defined the brief
Every hunch has a price
Wasted fuel
Search patterns instead of straight lines to productive water.
Wasted time
Longer days at sea for the same catch, and later returns to port.
Empty sets
Nets dropped on a hunch and hauled back with nothing to show for the diesel.
Two very different users
One on deck, one onshore
The fleet's daily work feeds science, and science sharpens the model that serves the fleet.
The captain on deck
Works in spray, wind and gloves, with no mobile signal for most of the day. So: offline-first, oversized touch targets that work with wet gloves, three-word zone verdicts instead of dashboards, and a two-tap catch log. If a feature needed a tutorial, it was cut.
The researcher onshore
Validated, geotagged catch records from working vessels are rare research data. A dedicated portal gives marine scientists a searchable paper library, a submission flow with institutional verification, and gated access to anonymized catch datasets.
The solution
Where will the fish feed tomorrow, and when?
A predictive fishing zone app that runs as a progressive web app on the phone or tablet the captain already owns. No new hardware, nothing wired into the vessel. The daily loop is deliberately simple.
Sync at the dock
One tap over the harbor signal pulls tomorrow's full forecast. About 4 MB carries the whole day.
Steam to the zone
Tomorrow's water is scored strong, good or weak. Each zone gets a heading, a distance and a feeding window on the chart.
Fish the window
The app names the hours the zone should fire, so the crew arrives set and ready instead of still searching.
Log and go home
Two taps record catch, species and weight, gloves on. Trip reports and CSV exports handle the paperwork.
Around the loop: a full day of offline charting from one sync, per-trip catch history by species and zone, and a fleet signal. When one captain spots surface activity such as flying fish and taps once, every vessel in range knows within seconds.
The captain's app
Built for the conditions, not the demo room
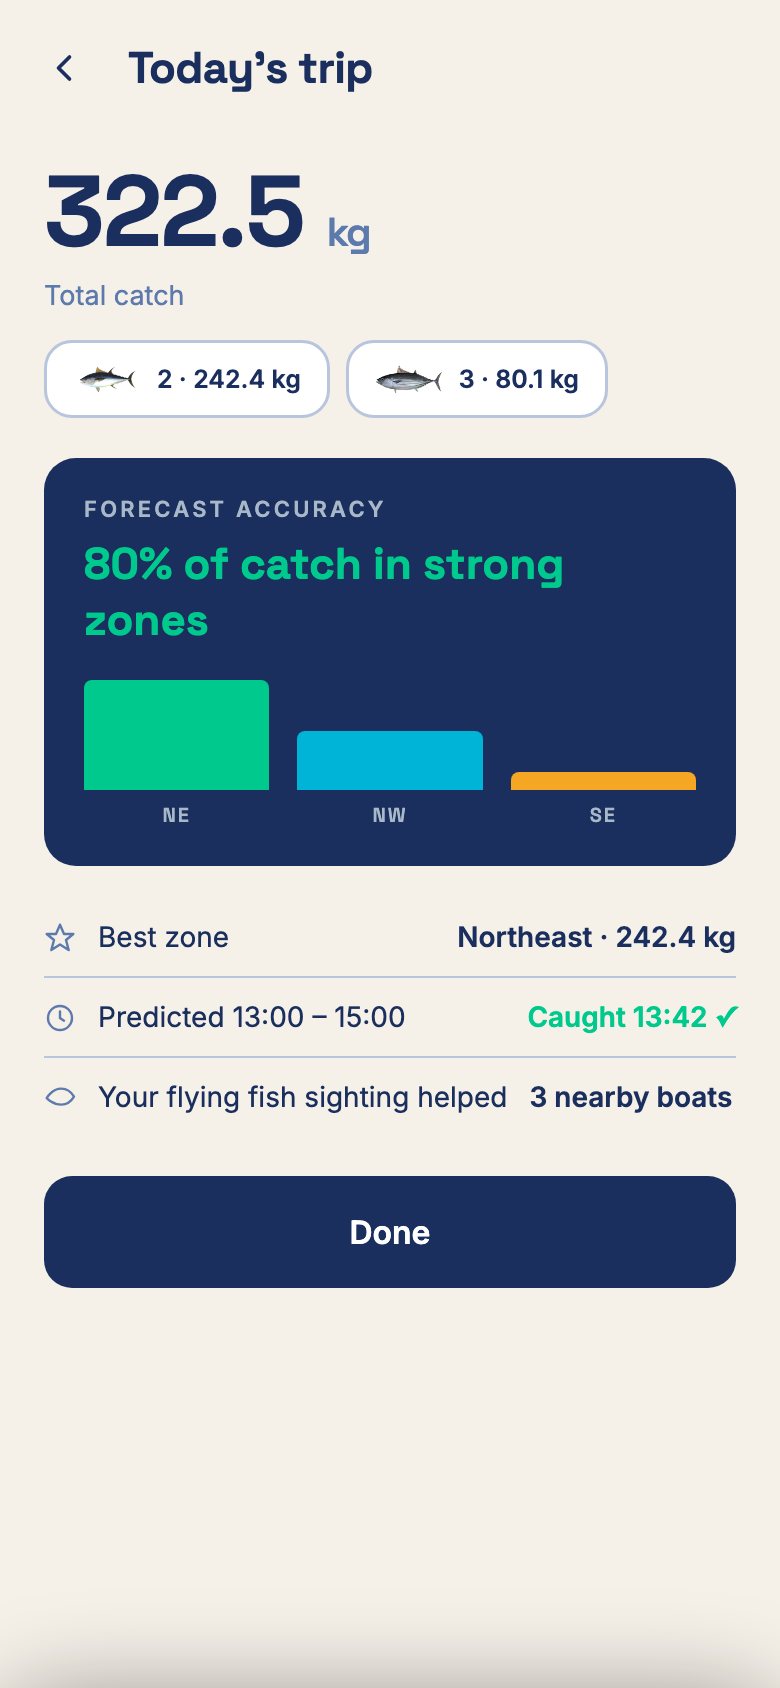
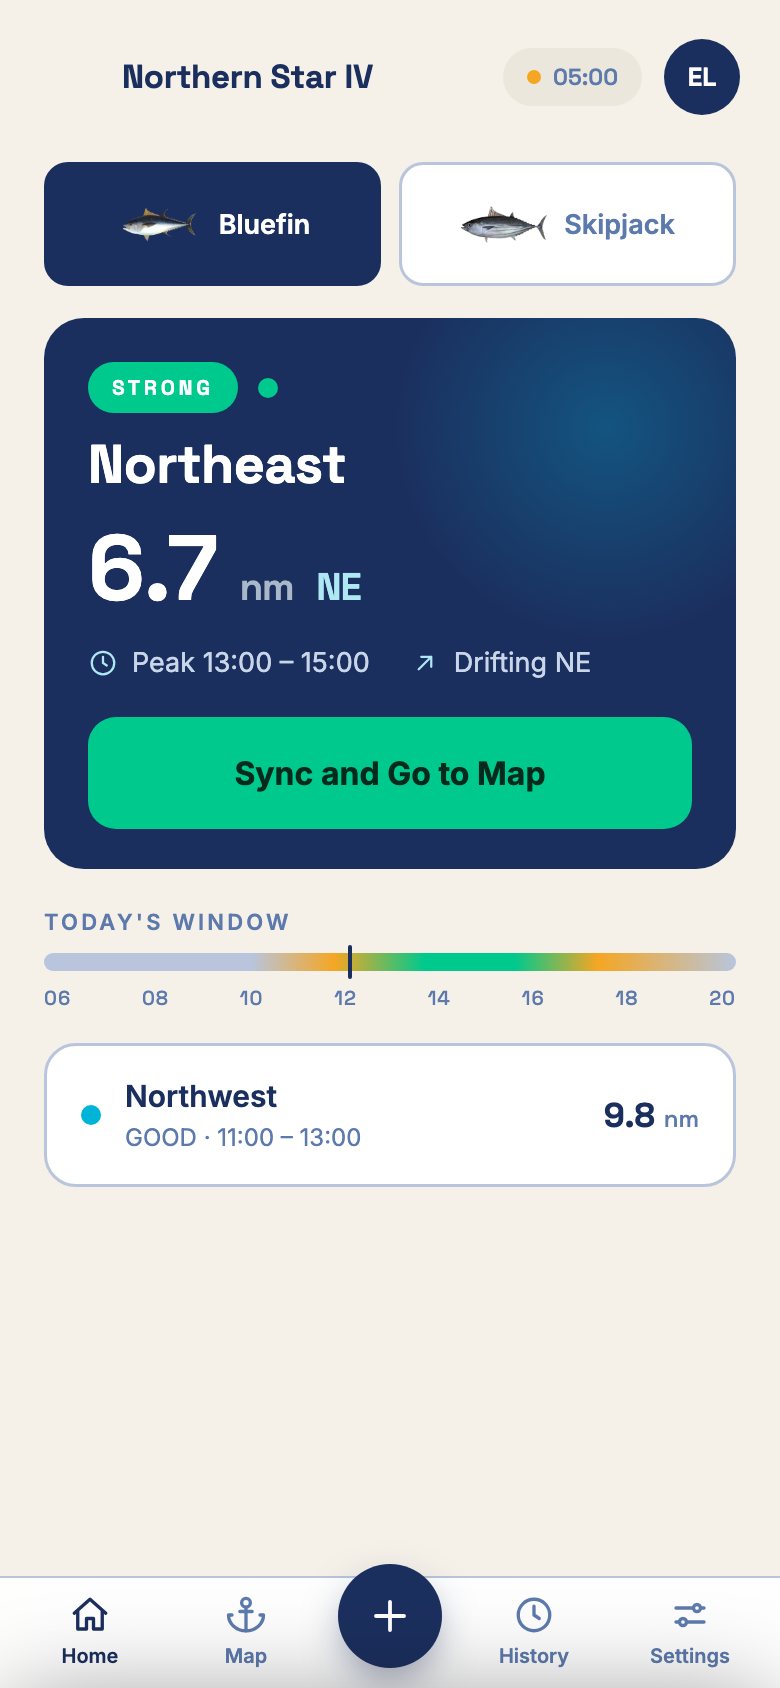
Before leaving portThe best zone, how far, which way, and the hours it should fire.
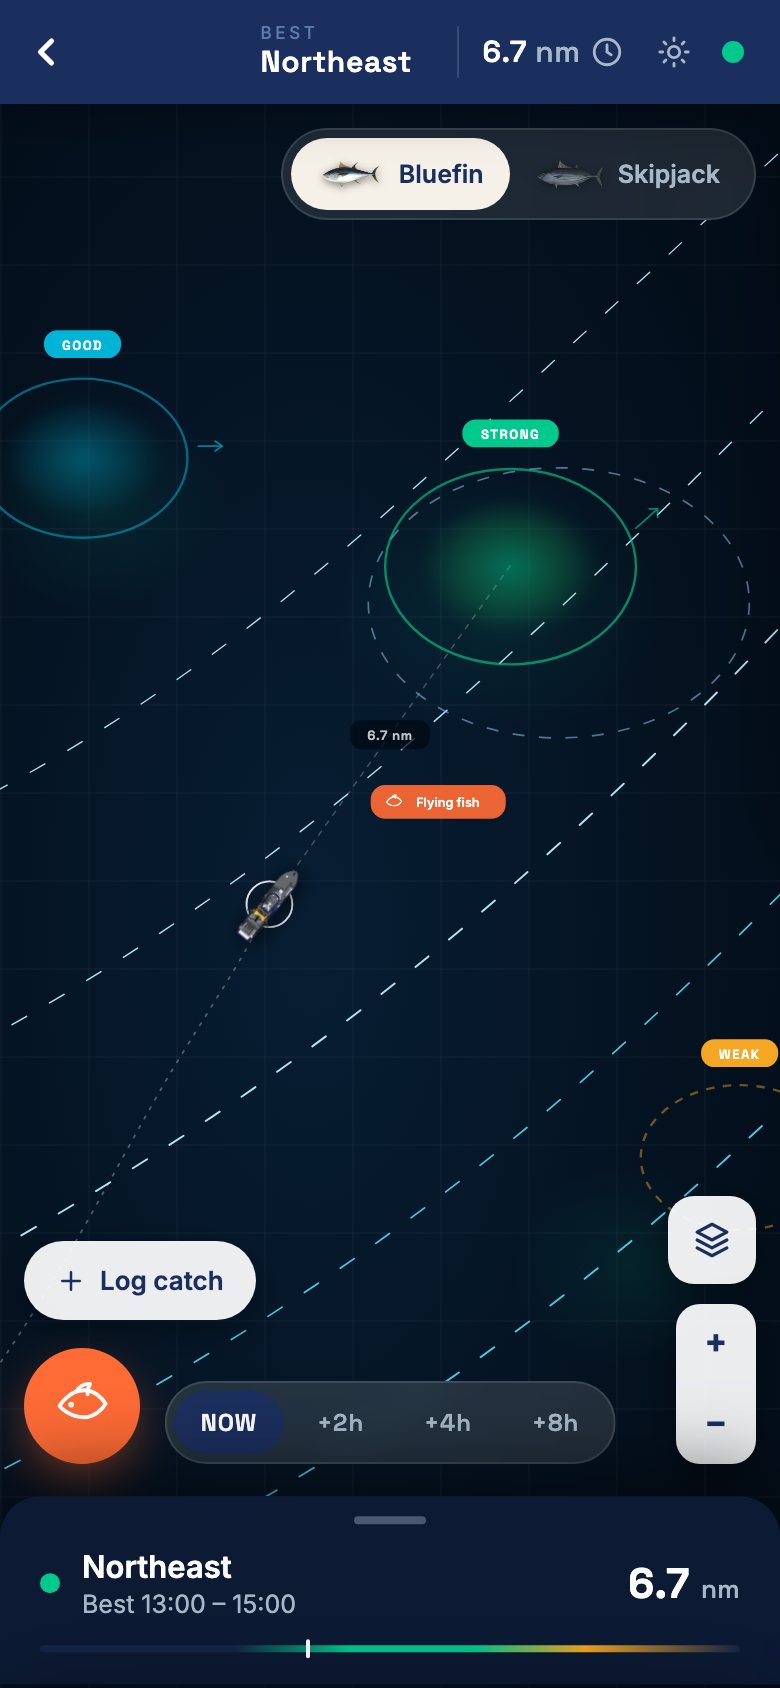
On the chartStrong, good and weak water, the boat, fleet sightings, and the forecast at +2h, +4h and +8h.
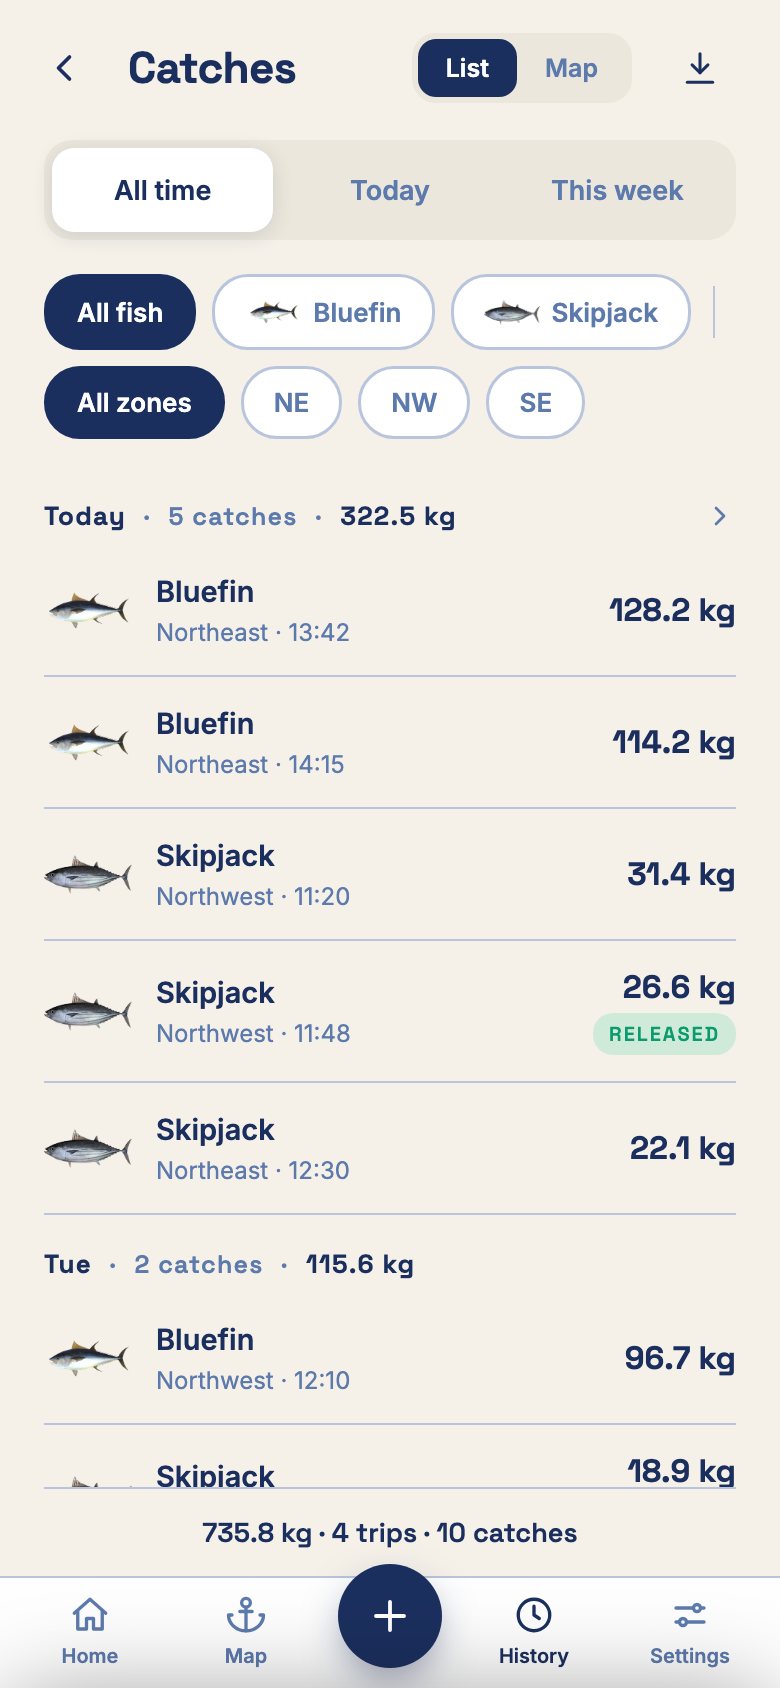
Heading homeCatch by zone, the predicted window against the actual haul, and who your sighting helped.
Prototype screens. Vessel, crew and catch values are demo data.
The AI predictive engine
Every night, while the fleet sleeps, the model reads the ocean
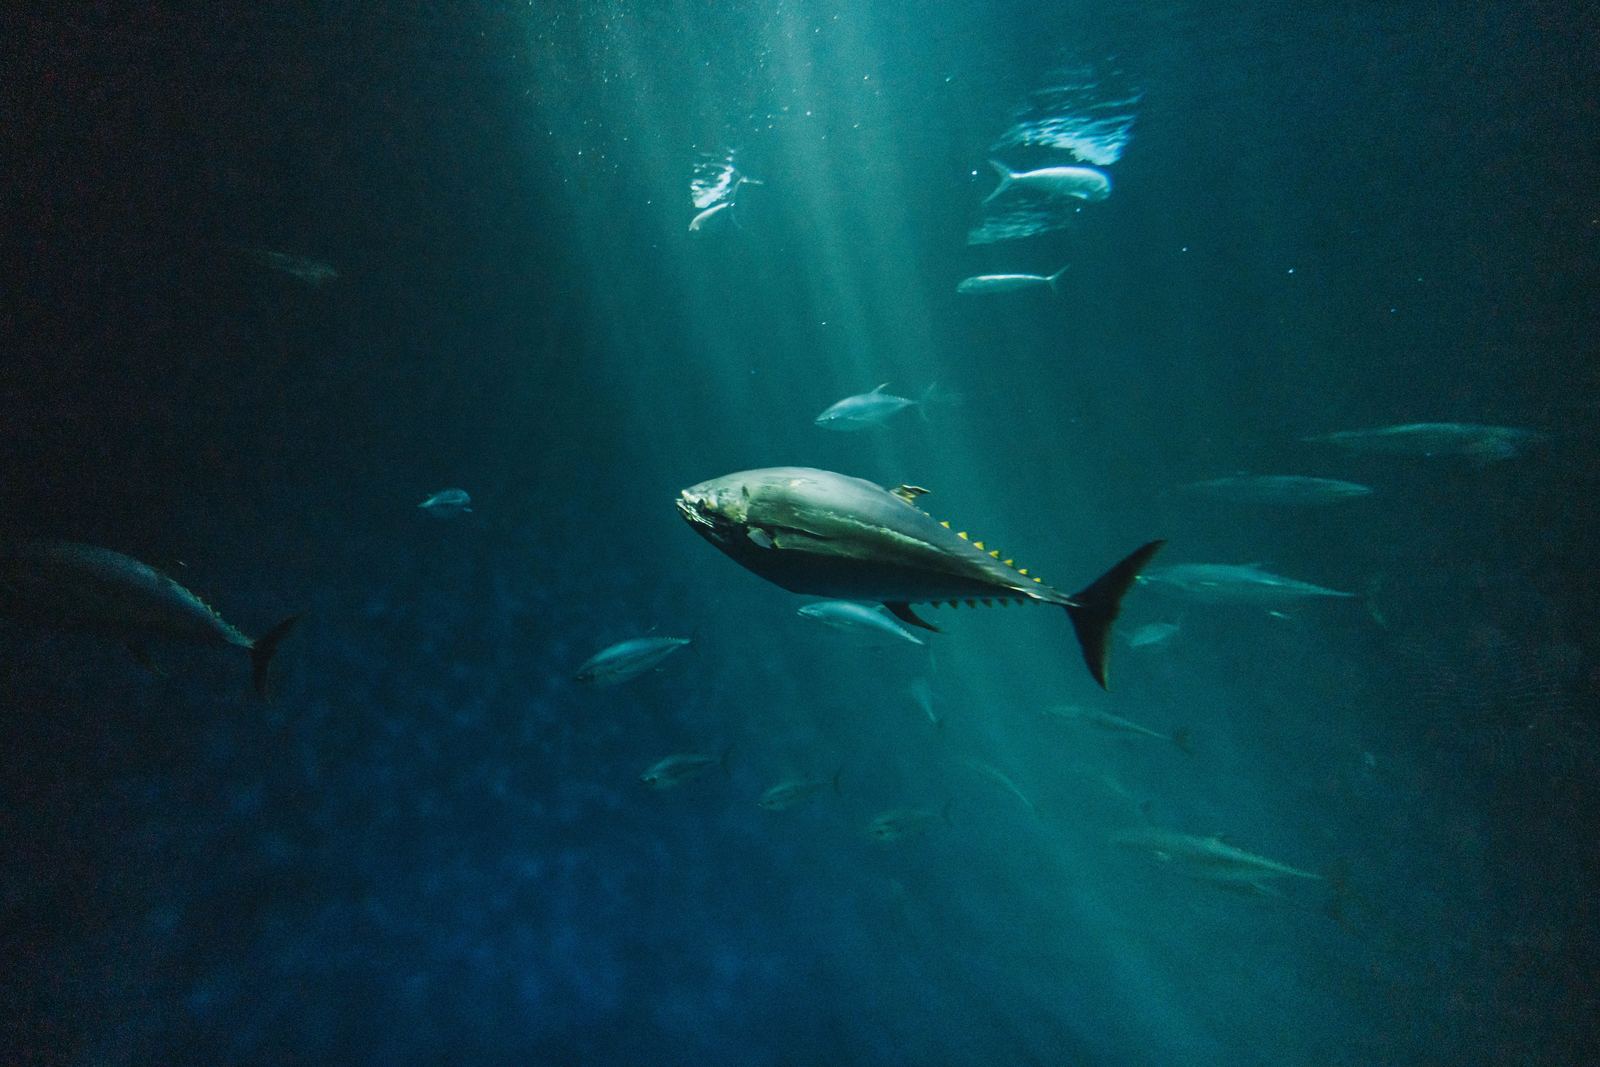
It ingests open oceanographic data: sea surface temperature, current and eddy structure, and chlorophyll signals that indicate baitfish activity. It scores the client's fishing grounds cell by cell, ranks tomorrow's water into strong, good and weak zones, and computes the feeding window for each.
Two decisions shaped the AI experience.
- Plain verdicts over probability scores. A captain does not need a confidence interval at 4 a.m. The output becomes three words a crew can act on: go here first, solid backup, skip it. The reasoning stays one tap away.
- The forecast is a loop, not a broadcast. Every logged catch and every tapped sighting flows back into training. Predictions are checked against real hauls daily, which keeps the model honest and compounds its accuracy as the fleet grows.
The forecast flywheel. More vessels fishing means more logged catches, which means sharper forecasts for every boat. That loop is the product's moat.
The researcher portal
Working vessels, feeding real science
A paper library with faceted search, a submission and verification flow for institutions, and gated access to the raw datasets behind the zone model.
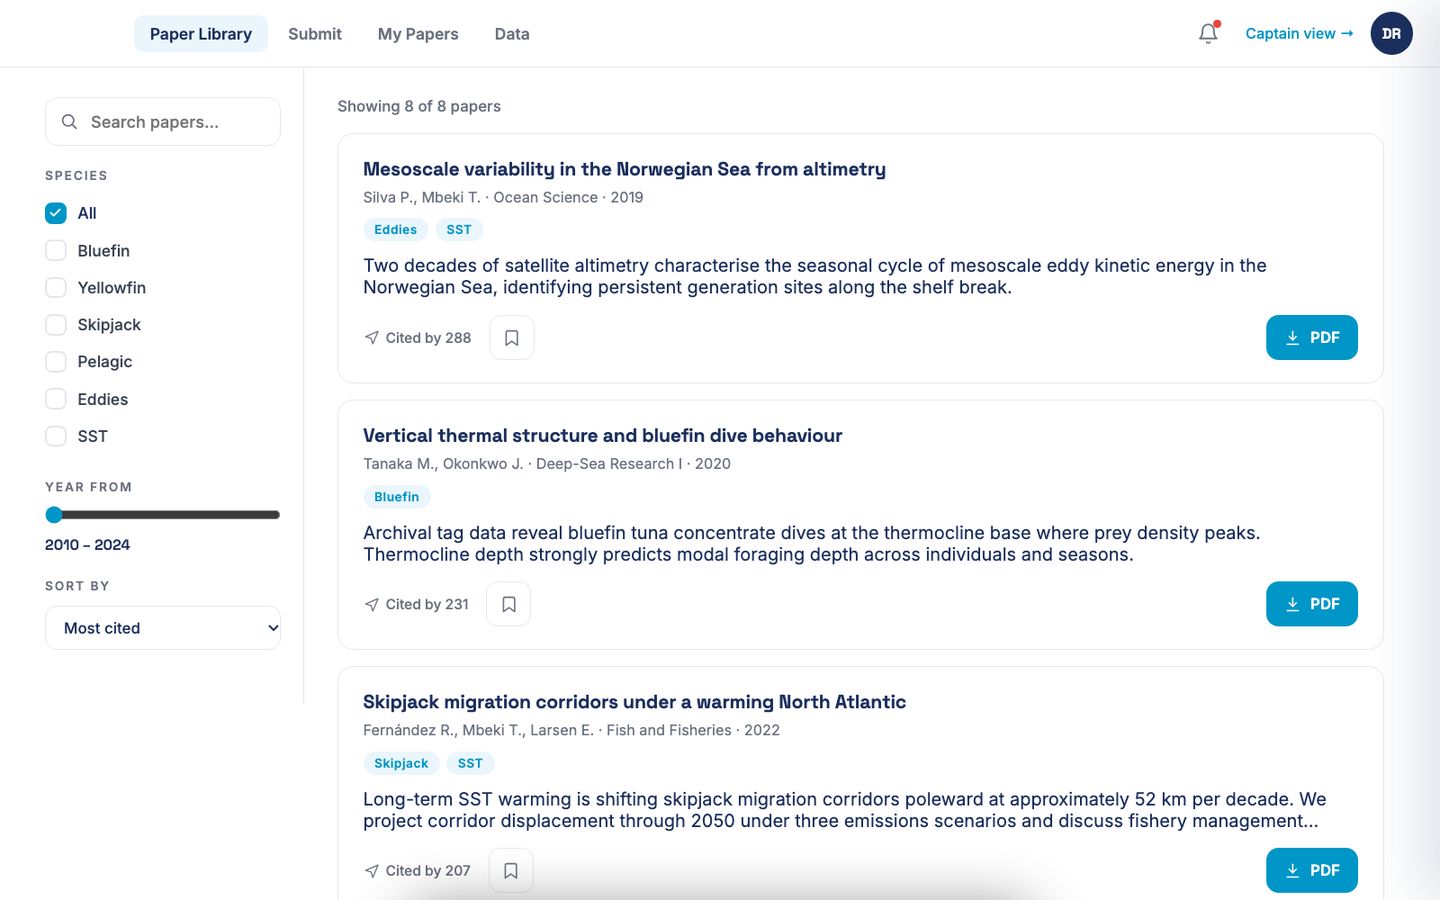
Paper library: filter by species, eddies and SST, sort by citations.
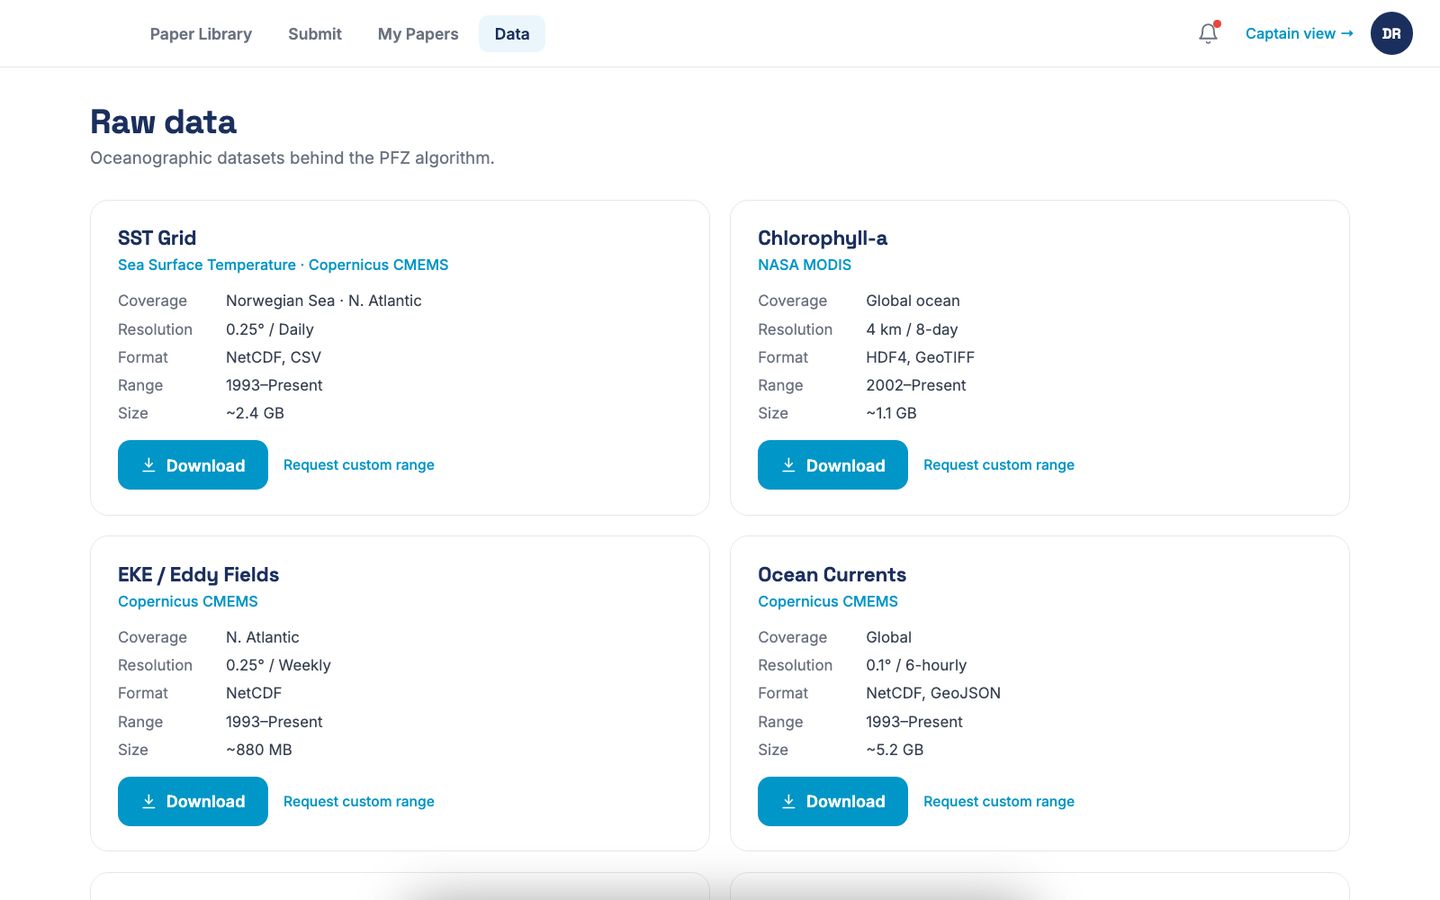
Raw data: the oceanographic datasets behind the zone algorithm.
Design and delivery
It reads like a nautical chart, not a SaaS dashboard
The design language borrows from the captain's own world: deep navy for the night sea, chart beige for the plotting table, and a bioluminescent teal reserved for the signal that matters. That is the mental model the user already trusts.
Specialist AI agents produced the interface screens, the working prototype and the launch website directions in parallel, while a human design lead reviewed and redirected the work at each approval gate. Iteration cycles that usually take a sprint took an afternoon.
- A working prototype of 30+ screens covering the full captain journey, from vessel registration and dock sync to the live zone chart and catch history
- A complete researcher portal: paper library, submission and verification, gated raw data
- A motion and interaction system: parallax imagery, scroll-driven reveals and a mascot that follows the cursor
“The route marker drifts off the boat.” Fixed, verified and re-rendered the same day.
Launch website directions
Three creative positions, tested before spending
Cinematic and photographic, editorial and typographic, and a motion-led concept built around a particle system that morphs between sections. Presenting genuinely different positions let the client test with real users before committing spend, a step that usually gets skipped because one polished direction already exhausts the budget.
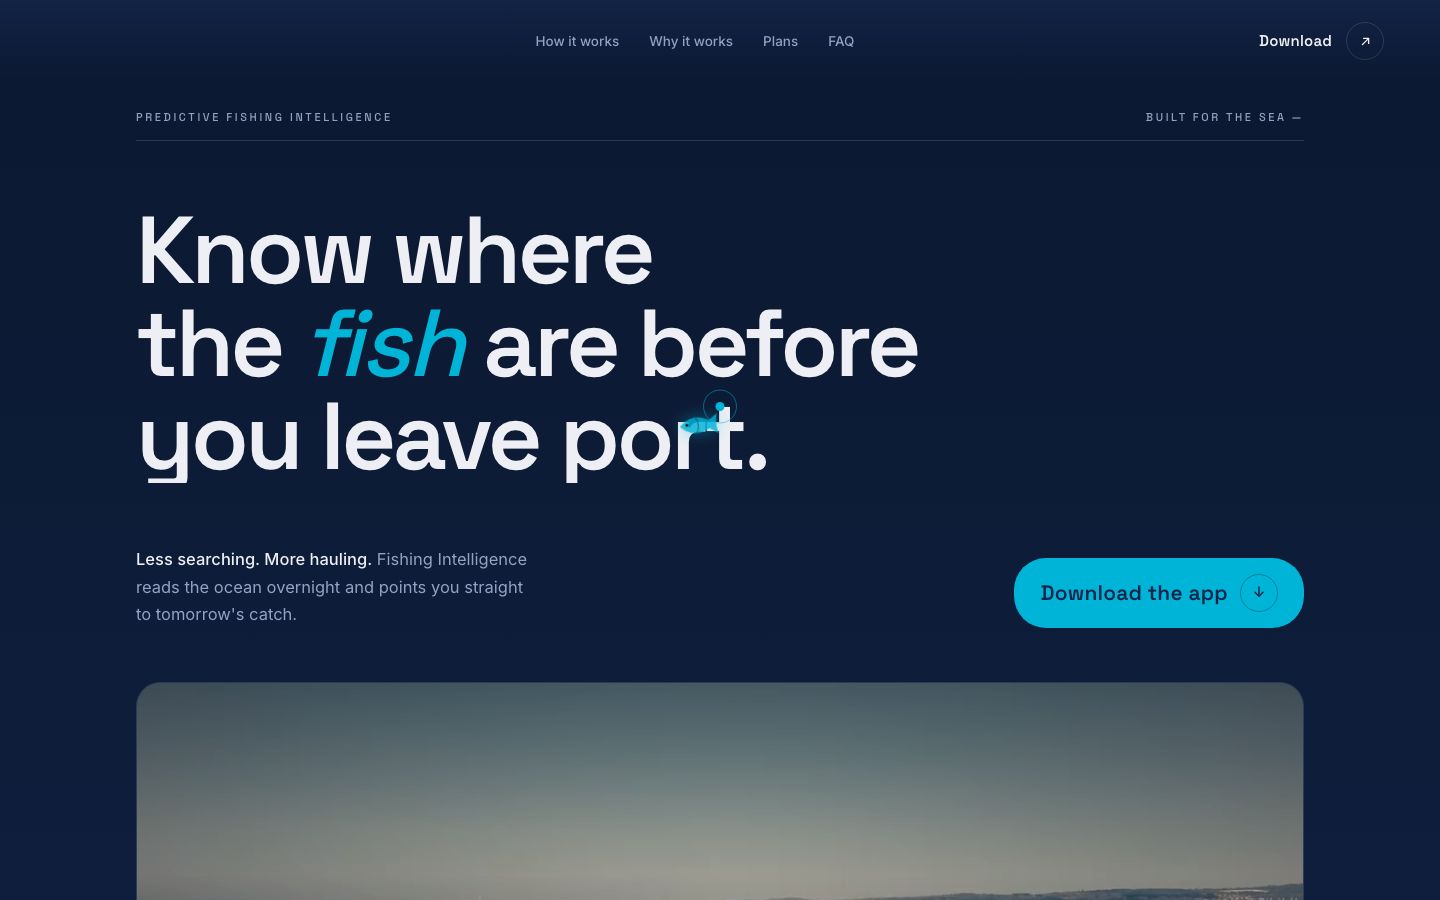
Editorial and typographic.
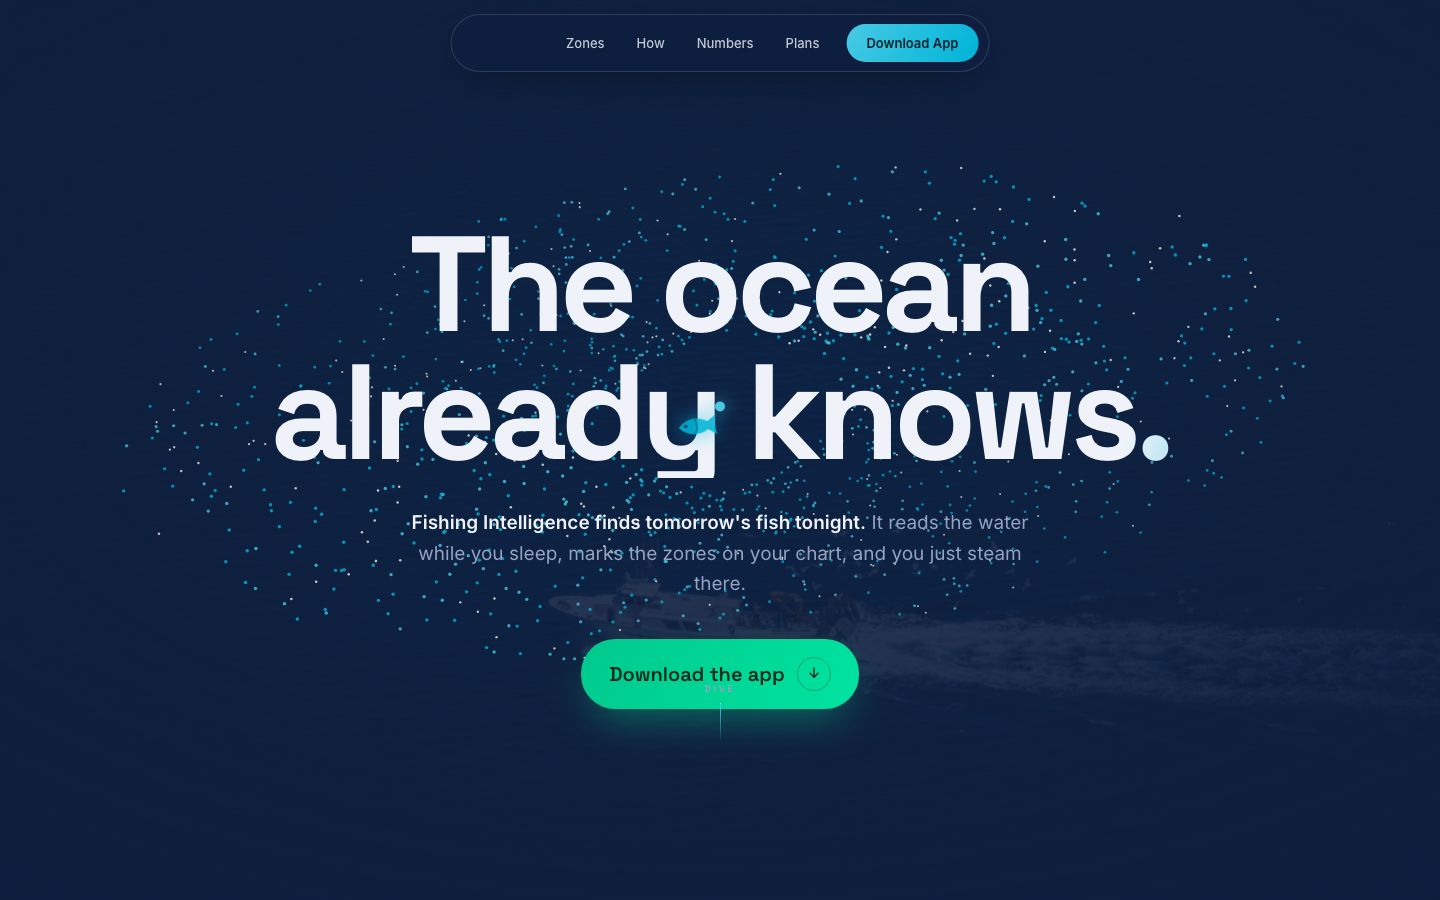
Motion-led, built around a morphing particle system.
What the engagement delivered
From first brief to client-ready in under two weeks
- A demo-grade prototype covering both user journeys, captain and researcher
- A 30+ screen captain app, from vessel registration to catch history
- A researcher portal with verification and gated data access
- Three launch website directions, ready for stakeholder testing
- A 30-day free trial funnel with no card required
- A motion and interaction system carried across every direction
The pattern behind the project
The hard part is not the model. It is the gloves.
Strip away the salt water and this is a repeatable shape: an industry where small operators make expensive decisions on instinct, public data that could inform those decisions, and no product built for the conditions the decision is actually made in. The same pattern holds for crop spraying windows, long-haul routing and site-visit scheduling.
This product went from brief to client-ready in under two weeks because AI agents did the production work and humans made the judgment calls. That is the working model behind NeoCrew, applied to one stubborn, salty, real-world problem.
Packaging a prediction so a working professional trusts it with gloves on.
What it's made of
The moving parts
Questions
Predictive fishing intelligence, answered
Who was the client?
An early-stage maritime technology venture building for small and mid-size trawler fleets. The engagement covered product design, a working prototype of 30+ screens, the AI forecast experience, a researcher portal and three launch website directions.
Does it need new hardware on the boat?
No. It runs as a progressive web app on the phone or tablet the captain already owns. Nothing is wired into the vessel.
Does it work without mobile signal?
Yes. One sync at the dock pulls about 4 MB, enough for a full day of offline charting with zero signal at sea. The catch log works offline too.
Where do the forecasts come from?
Open oceanographic data: sea surface temperature, current and eddy structure, and chlorophyll signals that indicate baitfish. The model scores the fishing grounds cell by cell every night and computes a feeding window for each zone. Logged catches and sightings flow back into training.
Why plain verdicts instead of probabilities?
Because a captain at 4 a.m. needs a decision, not a confidence interval. Zones read as go here first, solid backup, or skip it, with the reasoning one tap away.
How long did it take?
From first brief to a client-ready package in under two weeks, delivered on NeoCrew's four stages with AI agents doing the production work and a human design lead at every approval gate.
Keep reading
More built on NeoCrew
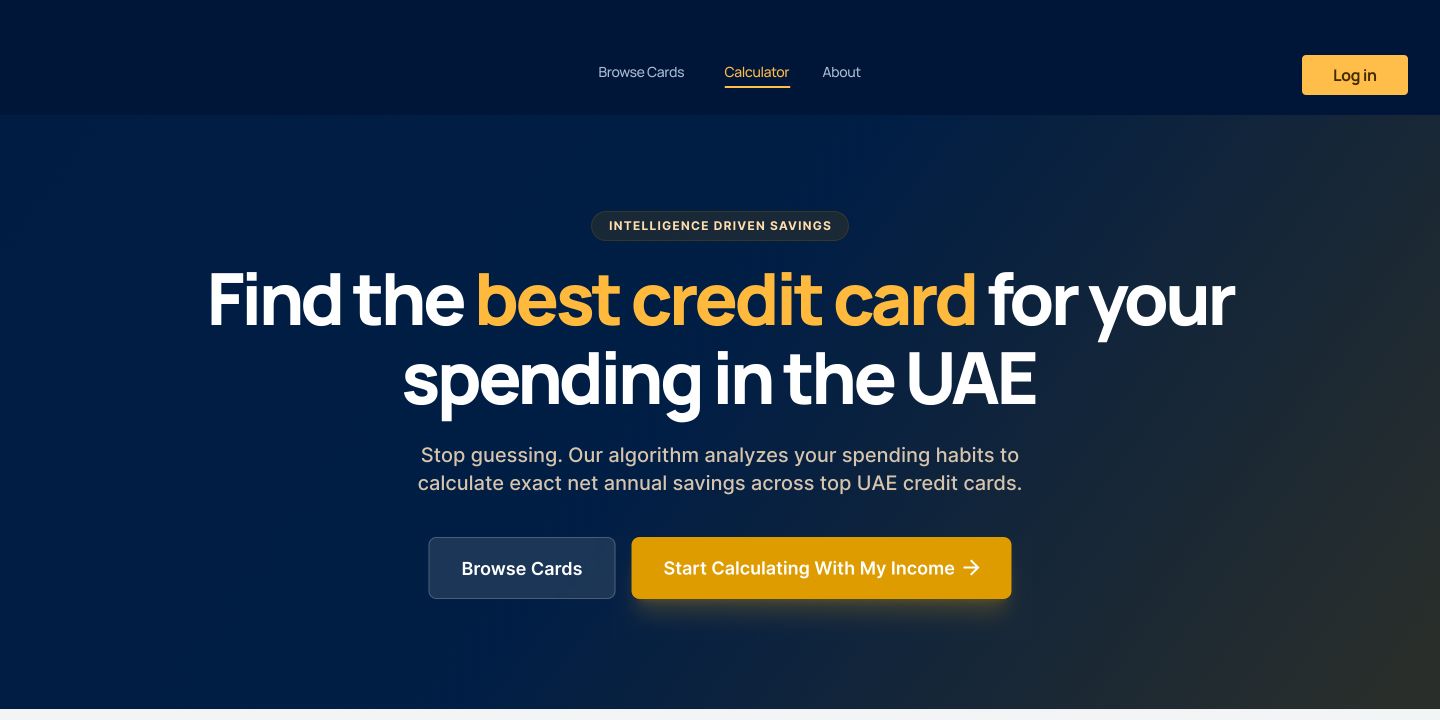
UAE credit card matchmaker
A UAE credit card matchmaker: spending in, top three cards out, sent to WhatsApp. No login anywhere in the path.
Read the case study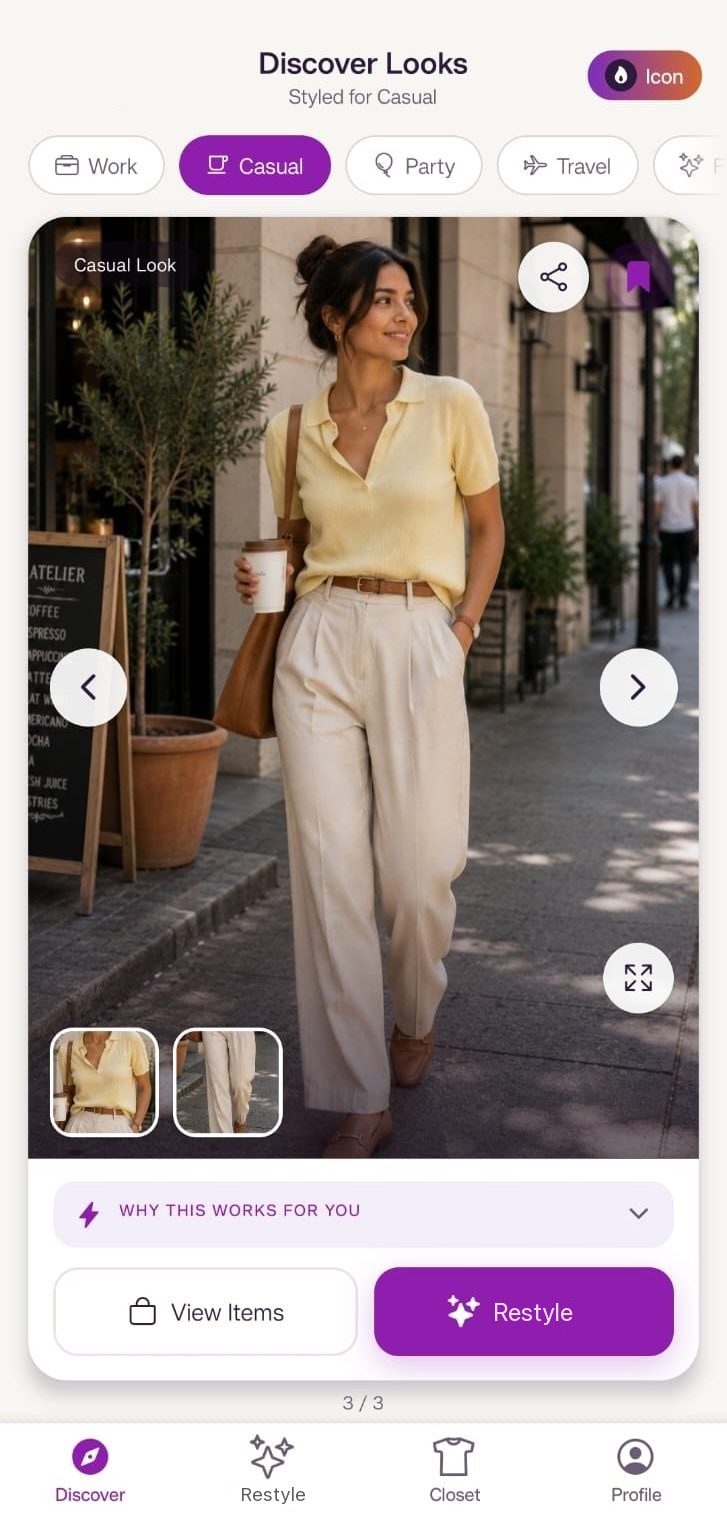
AI wardrobe stylist
An AI-native styling app that reads your wardrobe from photos and restyles looks on a model matched to your body type.
Read the case studyYour turn
Have a decision your users make on instinct?
If data could inform it, NeoCrew turns the idea into a product requirements document in one business day, free.